Direct answer
Anchor every RF voltage-to-power conversion to the load impedance and waveform crest factor before translating between decibel power and terminal voltage. Start with the sinusoidal conversion equations below, then check system impedance transitions, oscilloscope termination and modulation crest factor.
Key takeaways
- Include load resistance in every conversion between decibel power and terminal voltage.
- Account for voltage scaling and matching-pad insertion loss when moving between coaxial impedance standards.
- Verify oscilloscope input termination and signal crest factor before applying sinusoidal conversion constants.
Converting RF voltage to power requires specifying the termination resistance and waveform shape, or applying the wrong reference impedance skews the decibel readout. Start by anchoring the load impedance and waveform crest factor, then work through the sinusoidal equations, coaxial impedance transitions, oscilloscope termination checks, and RMS detector ratings below.
Explore the RF engineering hub for related measurement guides, or go directly to the RF link budget calculation and fade margin guide to apply converted carrier power levels across a complete receiver cascade.
Sinusoidal RF voltage to power equations and reference levels
In Marki Microwave’s power-to-voltage conversion formulas for load resistance R, P(dBm) = 10 log10 P(mW), P(mW) = 10^(P(dBm)/10), and P(mW) = [VRMS(V)]^2 * 10^3 / R.
In the Marki Microwave conversion equations, VRMS = 0.707 * VP and VP = sqrt(2) * VRMS for a sinusoid, VP = VRMS for a square wave, and peak-to-peak voltage VP-P = 2 * VP.
For a 0.001 W continuous-wave sinusoid across 50 ohms, V_RMS = sqrt(0.001 W x 50 ohms) = sqrt(0.05) = 0.2236 V RMS (223.6 mV), V_Peak = 0.2236 x sqrt(2) = 0.3162 V pk, V_pp = 2 x 0.3162 = 0.6325 Vpp, and the decibel voltage equivalents are -13.01 dBV, +46.99 dBmV, and +106.99 dBµV.
In the RF link-budget cascade equation, received carrier power at the LNA input plane is P_RX (dBm) = P_TX - L_TX + G_TX - FSPL - L_gas - L_rain - L_misc + G_RX - L_RX.
Sinusoidal conversion benchmarks in a matched system
Use the verified Marki Microwave table entries below when checking sinusoidal voltage swings at specific power levels:
- In the Marki Microwave conversion table for R = 50 ohms, -30 dBm equals 0.001 mW, 0.007 V rms, 0.010 Vp, and 0.020 Vpp.
- In the Marki Microwave conversion table for R = 50 ohms, -20 dBm equals 0.010 mW, 0.022 V rms, 0.032 Vp, and 0.063 Vpp.
- In the Marki Microwave conversion table for R = 50 ohms, -10 dBm equals 0.100 mW, 0.071 V rms, 0.100 Vp, and 0.200 Vpp.
- At the 0 dBm reference level in the Marki Microwave table for R = 50 ohms, 0 dBm equals 1.000 mW, 0.224 V rms, 0.316 Vp, and 0.632 Vpp.
- In the Marki Microwave conversion table for R = 50 ohms, +4 dBm equals 2.512 mW, 0.354 V rms, 0.501 Vp, and 1.002 Vpp.
- In the Marki Microwave conversion table for R = 50 ohms, +10 dBm equals 10.000 mW, 0.707 V rms, 1.000 Vp, and 2.000 Vpp.
- In the Marki Microwave conversion table for R = 50 ohms, +13 dBm equals 19.953 mW, 0.999 V rms, 1.413 Vp, and 2.825 Vpp.
- In the Marki Microwave conversion table for R = 50 ohms, +30 dBm equals 1000.000 mW, 7.071 V rms, 10.000 Vp, and 20.000 Vpp.
Extended milliwatt, volt, millivolt, and microvolt benchmarks
For wider dynamic range checks from high-power transmitter outputs down to receiver sensitivity levels, compare the Mini-Circuits conversion benchmarks:
- In the Mini-Circuits dBm-volts-watts conversion table for a 50-ohm system, +40 dBm equals 22.4 V and 10 W, -11 dBm equals 0.063 V, and -60 dBm equals 0.224 mV and 0.001 µW.
- In the Mini-Circuits 50-ohm system conversion table, +30 dBm equals 7.07 V and 1.0 W, while -20 dBm equals 22.4 mV and 0.01 mW.
- In the Mini-Circuits 50-ohm system conversion table, +13 dBm equals 1.00 V and 20 mW, -38 dBm equals 2.82 mV, and -87 dBm equals 10.0 µV.
- In the Mini-Circuits 50-ohm system conversion table, +4 dBm equals 0.354 V and 2.5 mW, while -47 dBm equals 1.00 mV.
Takeaway: Keep the load resistance and waveform shape attached to every voltage-to-power conversion record.
Reference impedance scaling and coaxial matching pads
In air-dielectric coaxial line design, the ideal conductor diameter ratio Dr for maximum power handling is 1.65 (corresponding to a 30-ohm characteristic impedance in air), and the 50-ohm impedance is the geometric mean of 30 ohms and 77 ohms: 50 approx sqrt(30 x 77) ohms.
Across 50-ohm RF, 75-ohm video, and 600-ohm audio loads respectively, RMS voltage at 0 dBm (1 mW) is 0.224 V, 0.274 V, and 0.775 V; at +10 dBm it is 0.707 V, 0.866 V, and 2.45 V; and at +13 dBm it is 1.00 V, 1.22 V, and 3.46 V.
At 0 dBm, a 75-ohm broadband and video load develops 0.2739 V RMS (273.9 mV) and 0.7746 Vpp, representing a +1.76 dB voltage offset relative to the 50-ohm reference across CATV cable, DOCSIS, and SDI broadcast video systems. At 0.010 W (+10 dBm) across a 75-ohm load, V_RMS = sqrt(0.010 W x 75 ohms) = sqrt(0.75) = 0.8660 V RMS (866.0 mV), V_Peak = 0.8660 x sqrt(2) = 1.2247 V pk, V_pp = 2 x 1.2247 = 2.4495 Vpp, and the decibel units are -1.25 dBV, +58.75 dBmV, and +118.75 dBµV.
Leaving Z0 at the 50-ohm default while converting a value actually measured on a 75-ohm cable or CATV line introduces about a 1.76 dB error in every voltage-based output.
Broadband cable driver and audio reference conventions
In the Analog Devices AD8325 CATV upstream line driver application, driving the 75-ohm coaxial cable at a nominal level of 1 V rms corresponds to +11.2 dBm, or 60 dBmV. In audio systems, 0 dBm often corresponds to approximately 0.775 volts because 0.775 V dissipates 1 mW in a 600-ohm load, and the corresponding voltage level is 0 dBu without the 600-ohm restriction.
Minimum-loss matching pad insertion loss
For the Mini-Circuits BMP-5075R+ 50/75-ohm coaxial matching pad across DC-2000 MHz, nominal attenuation is 5.7 +/- 0.1 dB with maximum flatness of 0.2 dB from DC to 100 MHz, 0.3 dB from 100 to 1000 MHz, and 0.4 dB from 1000 to 2000 MHz, maximum VSWR of 1.06 from DC to 100 MHz, 1.22 from 100 to 1000 MHz, and 1.4 from 1000 to 2000 MHz, and a 0.25 W power rating.
In a downconverting receiver, |RF - LO| = IF, and the same mixer also accepts an image sitting on the other side of the LO and therefore 2 x IF away from the wanted signal. For frequency-translation architecture details, see the RF, IF, and LO frequency conversion guide.
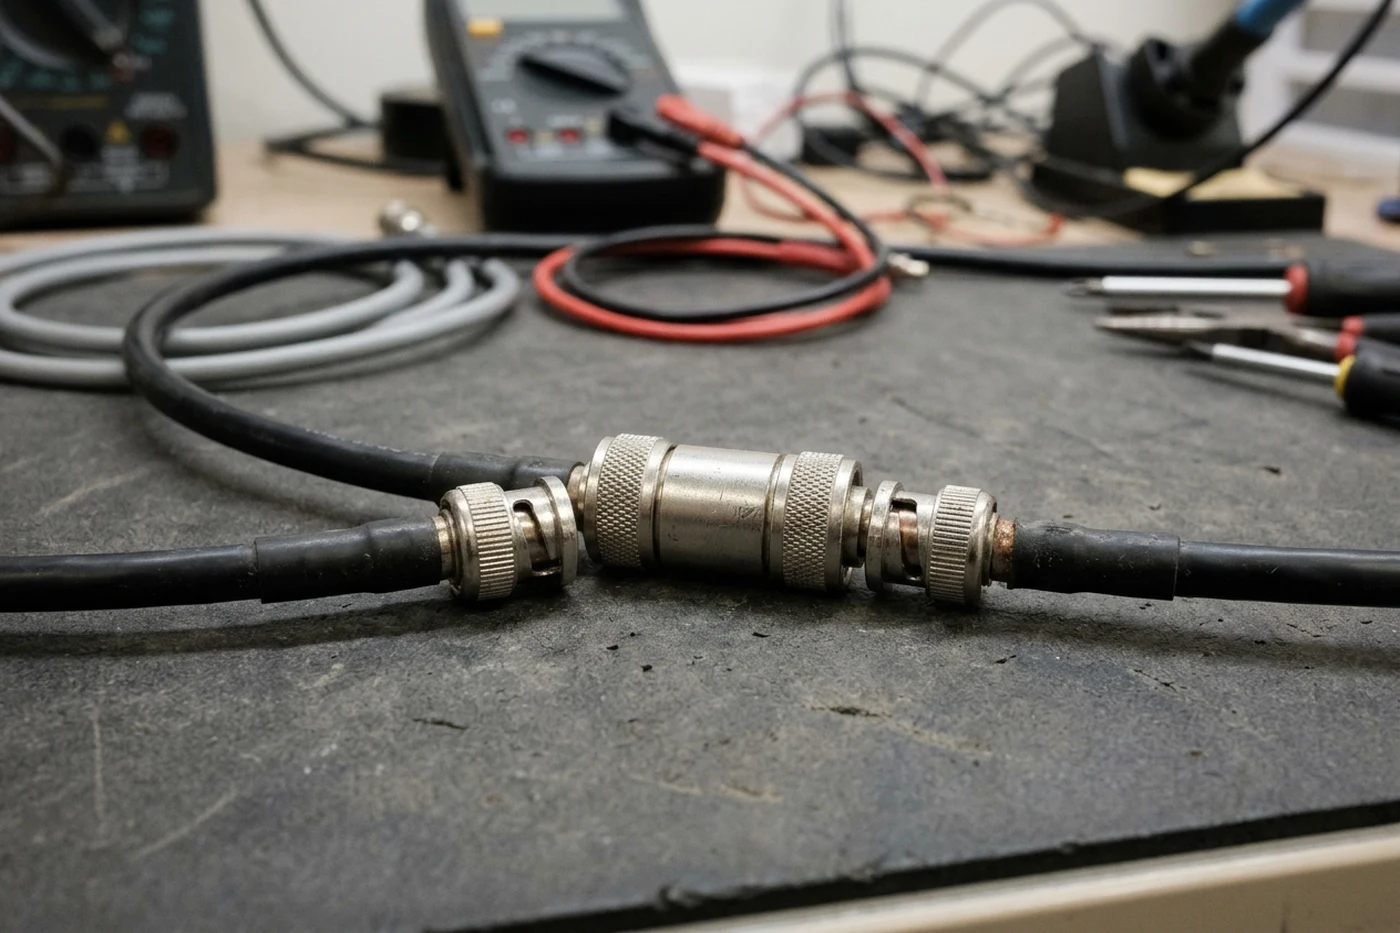
Takeaway: Account for both the impedance voltage offset and any matching-pad insertion loss when bridging different coaxial interfaces.
Oscilloscope input termination and component peak limits
A common value for oscilloscope nominal input impedance is 1 M-ohm resistance in parallel with 20 pF capacitance. When connecting a 50-ohm RF generator directly to a high-impedance 1 M-ohm oscilloscope channel without an inline 50-ohm feedthrough terminator, the lack of load termination causes total wave reflection, doubling the measured voltage (+6.02 dB / 2.0x voltage error).
For RF and IF return-loss and conversion operation on the HMC292LC3B mixer, the LO port requires at least +13 dBm across 16 to 30 GHz so the internal GaAs diodes turn on; without rated LO drive, the ports behave like an open or short. Review the mixer IF port termination and conversion-loss ripple guide when diagnosing reflective filter interfaces and port drive conditions.
Amplifier peak envelope and sequencing precautions
In Mini-Circuits’ Operating Precautions for Amplifiers (AN-60-008), RF amplifier maximum power ratings are generally based upon instantaneous voltage or current limitations of internal components, so amplifier ratings must be applied to the peak power of pulsed signals rather than the average power. Mini-Circuits notes that the most frequent causes of user-induced failure in ZHL-series amplifiers are excessive power applied to the input and improper sequencing of load connection, DC voltage, and RF signal.
Takeaway: Verify the oscilloscope port termination and apply component power ratings to the instantaneous peak envelope rather than average power.
Crest factor, PAPR, and RMS power detector selection
The peak-to-average power ratio (PAPR) is the peak power (peak amplitude squared) divided by the average power (mean square or squared RMS), and PAPR is the square of the crest factor. For normalized peak amplitude of 1, a DC signal has an RMS value of 1, a crest factor of 1, and a PAPR of 0.0 dB, whereas a sine wave has an RMS value of 1/sqrt(2) (approximately 0.707), a crest factor of sqrt(2) (approximately 1.414), and a PAPR of 3.01 dB.
Modulation crest factor and PAPR benchmarks
Compare the crest factor and peak-to-average power ratio across common modulation schemes before translating between average power and peak envelope voltage:
- In the waveform crest-factor table, QPSK has a 1.761 dB PAPR (with RMS and crest factor of 1 for unit amplitude), 8PSK and OQPSK have a 3.3 dB PAPR, pi/4-DQPSK has a 3.0 dB PAPR, and 8VSB has a 6.5 to 8.1 dB PAPR.
- In the waveform crest-factor table, 64QAM has a crest factor of approximately 1.528 and a 3.7 dB constellation PAPR.
- In the waveform crest-factor table, a WCDMA downlink carrier has a 10.6 dB PAPR, OFDM has a crest factor of 4 (approximately 12 dB PAPR), and constant-envelope GMSK has an RMS value of 1, a crest factor of 1, and a 0 dB PAPR.
RMS-responding detector characterization and impedance matching
The Analog Devices AD8361 TruPwr RMS detector specifies up to a 30 dB input range at 2.5 GHz, a maximum input of 700 mV rms (10 dBm, re 50 ohms), and a +/-0.25 dB linear response up to 2.5 GHz. The AD8361 RMS conversion error specifications list test conditions for a 5.5 dB peak-to-average ratio (IS95 reverse link) and a 12 dB peak-to-average ratio (W-CDMA 4 channels). On the AD8361 evaluation circuit, a 75-ohm resistor in Position R2 combines with the AD8361 internal input impedance to give a broadband input impedance of around 50 ohms.
The Analog Devices AD8362 TruPwr detector provides rms-to-dc conversion from 50 Hz to 3.8 GHz with an input dynamic range greater than 65 dB (-52 dBm to +8 dBm in 50 ohms) and a linear-in-decibels output scaled at 50 mV/dB. Having a 1:4 impedance ratio (1:2 turns ratio), the 200-ohm differential input resistance of the AD8362 becomes 50 ohms at the input to the balun.
The AD8362 filter-capacitor selection table lists modulated test waveforms for W-CDMA Single-Carrier Test Model 1-64, W-CDMA 4-Carrier Test Model 1-64, CDMA2000 Single-Carrier 9CH Test Model, CDMA2000 3-Carrier 9CH Test Model, and WiMAX 802.16 (64QAM, 256 subcarriers, 10 MHz bandwidth). In that AD8362 modulation table, the crest factor values for the listed schemes in order are 12.0 dB, 11.0 dB, 9.1 dB, 11.0 dB, and 14.0 dB. The AD8362 waveform measurement error plots characterize ERROR QPSK 4dB CF, ERROR 256QAM 8.2dB CF, ERROR CW, ERROR 64QAM 7.7dB CF, and ERROR WCDMA TM1-64 10.6dB CF.
Takeaway: Match the power detector architecture and averaging filter to the modulation crest factor instead of relying on uncalibrated sinusoidal peak relationships.
ADC full-scale voltage and transformer input matching
In the Analog Devices AD9446 16-bit, 80/100 MSPS ADC noise-figure example at VFS P-P = 3.2 V and fs = 80 MSPS, VFS-RMS = 1.13 V, and full-scale power is PFS = (1.13)^2 / 50 = 25.5 mW, or PFS(dBm) = +14.1 dBm. With a 1:2 turns-ratio RF transformer and a 249-ohm resistor in parallel with the AD9446 internal resistance, the net input impedance is 200 ohms, and the noise figure is improved by 6 dB because of the noise-free voltage gain of the transformer.
In Analog Devices’ ADC SNR tutorial, the theoretical SNR of an ideal N-bit ADC is SNR = 6.02N + 1.76 dB. For oscillator and clock spectral purity impacts on converter performance, see the phase noise engineering guide.
Takeaway: Include the front-end transformer turns ratio and parallel termination resistors when translating ADC full-scale peak-to-peak voltage into input power.
RF voltage and power conversion verification checklist
Use these prompts to document bench conditions before converting between oscilloscope voltage readouts, detector outputs, and decibel power levels.
System impedance and interface transitions
- Record the characteristic impedance of the source, cable, and load at each measurement plane.
- Identify whether decibel voltage figures are expressed relative to a volt, millivolt, or microvolt reference.
- Log the insertion loss, impedance ratio, and power rating of any inline resistive matching pad or transformer balun.
Oscilloscope and active stage boundaries
- Confirm whether the oscilloscope channel is set to a high-impedance input or terminated with an internal or external coaxial load.
- Verify that the signal generator output, mixer local-oscillator drive, and amplifier input remain within rated peak envelope limits.
- Follow proper connection sequencing by securing the load termination before applying supply voltage and RF drive.
Modulation crest factor and detector setup
- Record the modulation format, crest factor, and peak-to-average power ratio alongside the average power reading.
- Select an RMS-responding detector and averaging capacitance appropriate for the modulation envelope.
- For hardware block integration across upconversion and downconversion stages, review RF and microwave frequency converters.
Sources
- Marki Microwave — Power to Voltage Conversion Table
- Mini-Circuits — Application Note: dBm, Volts and Watts Conversion
- RF Calculator — dBm to Volts Calculator
- Everything RF — dBm to Volts Converter
- RF Tools — dBm to Vrms, Vpp, dBmV and Watts Conversion Reference
- Analog Devices — Tutorial: High Speed Variable Gain Amplifiers
- Mini-Circuits — Coaxial Matching Pad Data Sheet
- Analog Devices — TruPwr RMS Detector Data Sheets
- Analog Devices — Tutorial: ADC Noise Figure
- Analog Devices — Tutorial: Understand SINAD, ENOB, SNR, THD and SFDR
- Mini-Circuits — AN-60-008: Operating Precautions for Amplifiers
- Coaxial Cable, Decibel and Crest Factor Engineering Reference Compilations