Direct answer
An RF link budget calculator sums every logarithmic gain and loss from the transmitter power amplifier output (P_TX) to the receiver demodulator decision threshold (S_min) across five calibrated reference planes. Received carrier power at the LNA input plane is P_RX (dBm) = P_TX - L_TX + G_TX - FSPL - L_gas - L_rain - L_misc + G_RX - L_RX, where Free-Space Path Loss per ITU-R P.525 is FSPL = 92.45 + 20·log10(f_GHz) + 20·log10(d_km). Comparing P_RX against the receiver's integrated thermal noise floor N (dBm) = -174.0 dBm/Hz + 10·log10(BW_Hz) + NF_sys and required demodulator threshold SNR_req = (E_b/N_0)_req + 10·log10(R_b/BW_Hz) establishes the net system fade margin M_fade = P_RX - S_min.
Key takeaways
- Scaling carrier frequency from 10 GHz to 28 GHz with fixed 0.60 m dishes increases combined TX+RX aperture gain by +17.88 dB against +8.94 dB higher FSPL (+8.94 dB net gain), while narrowing 3 dB beamwidth from 3.50° to 1.25°.
- Never double-count pre-LNA passive insertion loss L_RX: either subtract L_RX from received carrier power P_RX at the LNA input plane (RP4) or add L_RX dB-for-dB into the antenna-referred noise figure NF_ant, never both.
- Over a 15.0 km hop (20 MHz BW, 80 Mbps 64-QAM), both 10 GHz (HMC7149 PA + HMC8410 LNA) and 28 GHz (ADPA7007 PA + Ka LNA) links close with >39 dB clear-sky fade margin (+44.19 dB vs. +39.11 dB).
- Under 25 mm/h heavy rain (ITU-R P.838/P.530 d_eff = 9.30 km), X-band loses only 3.48 dB (+40.71 dB margin, 64-QAM locked), whereas Ka-band loses 43.39 dB (-4.28 dB 64-QAM outage, rescued by QPSK ACM for +10.92 dB margin at 10 Mbps).
Building a production rf link budget calculator for terrestrial line-of-sight (LOS) backhaul, unmanned aerial vehicle (UAV) telemetry, or satellite ground terminals requires tracking signal power, antenna aperture physics, atmospheric propagation, and thermal noise across unambiguous reference planes. In practical rf and microwave engineering, link budgets fail when engineers plug saturated power amplifier (Psat) ratings into high-peak-to-average (64-QAM) modulation budgets, double-count preselector insertion loss (L_RX) in both received carrier power (P_RX) and receiver noise figure (NF), or neglect the steep power-law rise in specific rain attenuation (γ_R = k · R^α) between X-band (10.0 GHz), Ku-band (14.5 GHz), and Ka-band (28.0 GHz).
A complete RF link budget calculator evaluates received carrier power at the Low-Noise Amplifier (LNA) input reference plane (RP4) as P_RX (dBm) = P_TX - L_TX + G_TX - FSPL - L_gas - L_rain - L_misc + G_RX - L_RX, and compares P_RX against the receiver’s integrated thermal noise floor N (dBm) = -174.0 dBm/Hz + 10·log10(BW_Hz) + NF_LNA_chain and minimum demodulator sensitivity S_min = N + (E_b/N_0)_req + 10·log10(R_b/BW_Hz). Over a 15.0 km point-to-point hop (20 MHz noise bandwidth, 80 Mbps 64-QAM requiring SNR_req = 16.0 dB, 0.60 m parabolic dishes at η = 0.60), a 10.0 GHz X-band link (HMC7149 GaN PA at +34.0 dBm linear output + HMC8410 1.1 dB NF LNA) achieves +44.19 dB clear-sky fade margin and retains +40.71 dB margin under 25 mm/h (99.95% availability) heavy rain (L_rain = 3.48 dB). Over the identical 15.0 km path, a 28.0 GHz Ka-band link (ADPA7007 GaAs PA at +25.5 dBm linear output + 2.2 dB NF Ka LNA) achieves +39.11 dB clear-sky margin because higher dish gain (+42.69 dBi vs. +33.75 dBi per end) outpaces higher FSPL (144.91 dB vs. 135.97 dB), but suffers 43.39 dB of 25 mm/h rain attenuation—driving 64-QAM into a -4.28 dB outage that requires Adaptive Coding and Modulation (ACM) downshift to QPSK (+5.22 dB margin at 20 Mbps or +10.92 dB margin at 10 Mbps).
This reference guide belongs to the RF engineering guides hub and connects electromagnetic propagation modeling to the hardware architectures in the RF signal chain and microwave components sections. For the internal stage-by-stage receiver and transmitter MMIC cascade behind the antenna port, pair this link budget with RF module transmitter and receiver cascade architecture and RF transceiver module TDD vs. FDD front-end isolation.
End-to-End RF Link Budget Architecture and Master RF Calculation Formula Reference
As established in NASA JPL DESCANSO Monograph 1 (Telecommunications Link Design) and the NASA Small Spacecraft Technology State-of-the-Art Communications benchmark, a rigorous rf link budget calculator partitions a wireless transmission path into five physical Reference Planes (RP1 through RP5):
RP1— Transmit Power Amplifier Linear Output Plane: Evaluated at the 50 Ω output port of the final High-Power Amplifier (HPA), such as the Analog Devices HMC7149 (6–18 GHz,10 W/+40 dBmGaN PA) or ADPA7007 (20–44 GHz,+31.5 dBmGaAs pHEMT PA), after subtracting the required Output Power Back-Off (OBO) to satisfy constellation Error Vector Magnitude (EVM) and Adjacent Channel Power Ratio (ACPR).RP2— Transmit Antenna Aperture Plane (EIRP): Combines linear PA output powerP_TX(dBm), transmit harmonic filter / isolator / coaxial or waveguide feeder lossL_TX(dB), and transmit antenna boresight gainG_TX(dBi) into Effective Isotropic Radiated Power (EIRP = P_TX - L_TX + G_TX).RP3— Free-Space and Tropospheric Propagation Channel: Accounts for spherical wavefront spreading per Recommendation ITU-R P.525 (Calculation of Free-Space Attenuation), clear-air oxygen (O2) and water-vapor (H2O) molecular absorption per ITU-R P.676, specific and path-reduced rain attenuation per ITU-R P.838 and ITU-R P.530, and First Fresnel Zone (F_1) diffraction clearance.RP4— Receiver LNA Input Reference Plane: Captures the electromagnetic wave via receive aperture gainG_RX(dBi), subtracts pointing (L_pt), polarization (L_pol), radome (L_radome), and pre-LNA passive filter/limiter insertion loss (L_RX), and establishes the carrier-to-noise ratio (SNR = P_RX - N) against the cascaded receiver noise figure (NF_LNA_chain).RP5— Demodulator Baseband Decision Plane: Converts channelSNRin noise bandwidthBWinto normalized bit energy-to-noise spectral densityE_b/N_0at bit rateR_b(bps) and computes the net System Fade Margin (M_fade = P_RX - S_min).
Master RF Calculation Formula Reference Table (11 Governing Equations)
Every rf calculation formula required to build or audit an end-to-end rf link budget calculator is consolidated in the 11-row engineering reference table below:
| # | RF Engineering Parameter | Symbol | Governing Logarithmic / Linear RF Calculation Formula | Units | Physical Meaning & Reference Standard |
|---|---|---|---|---|---|
| 1 | Effective Isotropic Radiated Power | EIRP |
EIRP (dBm) = P_TX (dBm) - L_TX (dB) + G_TX (dBi) (where dBW = dBm - 30) |
dBm or dBW |
Equivalent power radiated by an isotropic (0 dBi) radiator to match peak boresight flux at RP2 (JPL DESCANSO) |
| 2 | Parabolic Aperture Gain & Half-Power Beamwidth | G_ant, θ_3dB |
G (dBi) = 10·log10(η_ap) + 20·log10(π·D / λ) = 10·log10(η_ap) + 20·log10(π·D·f / c)θ_3dB (deg) ≈ 70° · (λ / D) |
dBi, degrees (°) |
Aperture efficiency η_ap = 0.55–0.65 for prime-focus/Cassegrain dishes; doubling f at fixed D adds +6.02 dB per dish (NASA SmallSat SOA) |
| 3 | Free-Space Path Loss | FSPL |
FSPL (dB) = 20·log10(4·π·d / λ) = 92.45 + 20·log10(f_GHz) + 20·log10(d_km)(or 32.44 + 20·log10(f_MHz) + 20·log10(d_km)) |
dB |
Far-field (d > 2·D^2/λ) spherical spreading 1/(4·π·d^2) plus isotropic capture area λ^2/(4·π) (ITU-R P.525) |
| 4 | First Fresnel Zone Radius & Clearance | F_1 |
F_1 (m) = 17.32 · sqrt( (d_1 · d_2) / (f_GHz · d_total) ) (with d_1, d_2, d_total in km) |
meters (m) |
Ellipsoidal zone where path length excess is λ/2; requires >= 0.6 · F_1 unobstructed clearance for 0 dB diffraction loss (ITU-R P.530) |
| 5 | Atmospheric Gaseous Absorption | L_gas |
L_gas (dB) = (γ_o + γ_w) · d_km |
dB |
Dry-air O2 (γ_o, 60 GHz complex) plus water-vapor H2O (γ_w, 22.235 GHz dipole resonance peak) (ITU-R P.676) |
| 6 | Specific & Effective-Path Rain Attenuation | γ_R, L_rain |
γ_R (dB/km) = k · R^αL_rain (dB) = γ_R · d_eff + L_wet_radome = γ_R · (d · r) + L_wet_radome |
dB/km, dB |
Power-law function of point rain rate R (mm/h) (ITU-R P.838) scaled by cell reduction factor r <= 1 (ITU-R P.530) |
| 7 | Pointing, Polarization & VSWR Mismatch Losses | L_pt, L_pol, L_mis |
L_pt (dB) = 12 · (Δθ / θ_3dB)^2`L_pol (dB) = -20·log10( |
cos ψ | )<br/>L_mis (dB) = -10·log10(1 - |
| 8 | Friis Cascaded Receiver Noise Factor | F_total, NF_sys |
F_total = F_1 + (F_2 - 1)/G_1 + (F_3 - 1)/(G_1·G_2) + ...NF_sys (dB) = 10·log10(F_total) |
Linear ratio, dB |
Input-referred noise factor referenced to T_0 = 290 K; first-stage passive loss adds 1:1 in dB (Analog Devices MT-006) |
| 9 | System Noise Temperature & Receiver G/T |
T_sys, G/T |
T_sys (K) = T_ant + T_0 · (10^(NF_rx / 10) - 1)G/T (dB/K) = (G_RX - L_RX) - 10·log10(T_sys) |
Kelvin (K), dB/K |
Antenna noise temperature T_ant plus receiver equivalent noise temperature at T_0 = 290 K (JPL DESCANSO) |
| 10 | Thermal Noise Floor, C/N_0, SNR & E_b/N_0 |
N, C/N_0, SNR, E_b/N_0 |
N (dBm) = -174.0 dBm/Hz + 10·log10(BW_Hz) + NF_sysC/N_0 (dB-Hz) = P_RX - (-174.0 + NF_sys) = SNR + 10·log10(BW_Hz)E_b/N_0 (dB) = C/N_0 - 10·log10(R_b) = SNR - 10·log10(R_b / BW_Hz) |
dBm, dB-Hz, dB |
Available thermal noise density k_B·T_0 = -173.975 dBm/Hz (-174.0 dBm/Hz) at 290 K (Steer, Ch. 4) |
| 11 | Minimum Receiver Sensitivity & Fade Margin | S_min, M_fade |
S_min (dBm) = -174.0 dBm/Hz + 10·log10(BW_Hz) + NF_sys + SNR_reqM_fade (dB) = P_RX (dBm) - S_min (dBm) = SNR_actual - SNR_req |
dBm, dB |
Net decibel headroom above demodulator lock threshold for a target BER/FER (Steer, Ch. 4, ITU-R P.530) |
Free-Space Path Loss (FSPL), Fixed-Aperture Scaling, and Physical Interface Losses
A frequent misconception in rf and microwave engineering is that higher carrier frequencies “attenuate faster in vacuum” because the rf calculation formula for Free-Space Path Loss (FSPL) contains a +20·log10(f) term. Deconstructing the Friis transmission equation per Recommendation ITU-R P.525 (Calculation of Free-Space Attenuation) reveals the exact physical origin of that frequency term—and proves why fixed-area dish links actually achieve higher clear-sky received power at higher frequencies.
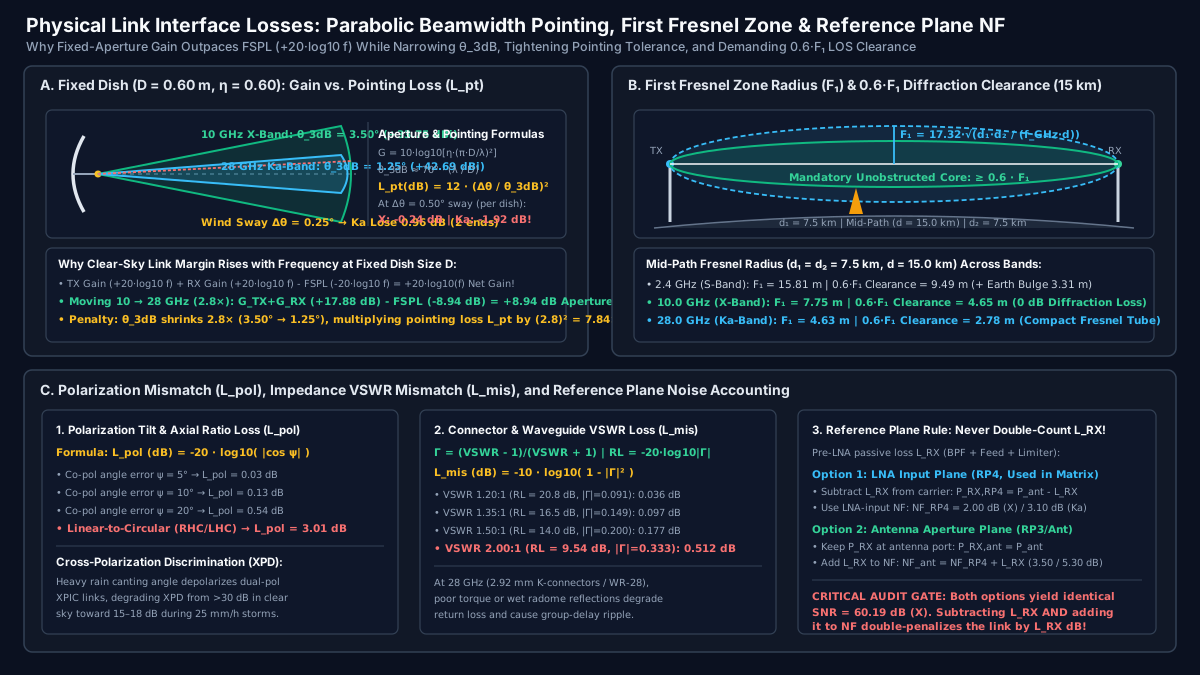
1. Deriving ITU-R P.525 Free-Space Path Loss and the Fixed-Aperture Paradox
At distance d (in meters, within the Fraunhofer far field d > 2·D^2 / λ) from a transmitter radiating EIRP = P_TX · G_TX (watts), spherical wavefront expansion spreads power uniformly over a sphere of surface area 4·π·d^2, producing incident power flux density S = EIRP / (4·π·d^2) (W/m^2). Notice that S is completely independent of frequency f.
A receiving antenna with physical aperture area A_phys (m^2) and aperture efficiency η_ap captures power P_RX = S · A_eff, where the effective capture area is linked to antenna gain G_RX and wavelength λ = c / f (c = 2.99792458 × 10^8 m/s) by fundamental thermodynamics:
A_eff = η_ap · A_phys = (λ^2 / (4 · π)) · G_RX ⇒ G_RX = (4 · π · η_ap · A_phys) / λ^2
When ITU-R P.525 defines Free-Space Basic Transmission Loss (L_bf or FSPL), it sets G_TX = 1 (0 dBi) and G_RX = 1 (0 dBi). For an isotropic receive antenna (G_RX = 1), the effective capture area is A_iso = λ^2 / (4·π), which shrinks as 1 / f^2. Combining 1 / (4·π·d^2) with λ^2 / (4·π) gives:
FSPL_linear = (4 · π · d / λ)^2 = (4 · π · d · f / c)^2
FSPL (dB) = 20 · log10(4 · π · d · f / c) = 92.45 + 20 · log10(f_GHz) + 20 · log10(d_km)
Now examine what happens when you hold the physical parabolic dish diameter D constant (A_phys = π · D^2 / 4) at both ends of the link and scale carrier frequency from f_1 = 10.0 GHz (X-band, λ = 30.0 mm) to f_2 = 28.0 GHz (Ka-band, λ = 10.71 mm)—a frequency ratio of 28.0 / 10.0 = 2.80× (20·log10(2.80) = 8.94 dB):
- Free-Space Path Loss (
FSPLatd = 15.0 km,20·log10(15.0) = 23.52 dB):- At
10.0 GHz:FSPL = 92.45 + 20.00 + 23.52 =135.97 dB. - At
28.0 GHz:FSPL = 92.45 + 28.94 + 23.52 =144.91 dB(8.94 dBhigher loss).
- At
- Parabolic Dish Gain (
D = 0.60 m,η_ap = 0.60):- At
10.0 GHz:G_ant = 10·log10(0.60) + 20·log10(π × 0.60 / 0.030) = -2.22 + 35.97 =+33.75 dBiper dish (+67.50 dBicombinedG_TX + G_RX). - At
28.0 GHz:G_ant = 10·log10(0.60) + 20·log10(π × 0.60 / 0.01071) = -2.22 + 44.91 =+42.69 dBiper dish (+85.38 dBicombinedG_TX + G_RX—+17.88 dBhigher combined antenna gain!).
- At
- Net Aperture-to-Path-Loss Balance (
G_TX + G_RX - FSPL):- At
10.0 GHz:+67.50 - 135.97 =-68.47 dB. - At
28.0 GHz:+85.38 - 144.91 =-59.53 dB(+8.94 dBnet clear-sky power advantage at28.0 GHz!).
- At
2. Half-Power Beamwidth (θ_3dB), Pointing Error (L_pt), Polarization (L_pol), and VSWR (L_mis)
The +8.94 dB fixed-aperture gain bonus at 28.0 GHz comes with a strict mechanical penalty: the antenna’s half-power (-3 dB) beamwidth θ_3dB ≈ 70° · (λ / D) contracts linearly with wavelength λ, causing off-axis pointing loss L_pt (dB) = 12 · (Δθ / θ_3dB)^2 to scale as f^2:
| Mechanical or Electrical Interface Parameter | Governing Formula | 10.0 GHz X-Band (D = 0.60 m) |
28.0 GHz Ka-Band (D = 0.60 m) |
Engineering Impact on Link Budget |
|---|---|---|---|---|
| Wavelength & Fraunhofer Far-Field Distance | λ = c / f; d_FF = 2 · D^2 / λ |
λ = 30.00 mm; d_FF = 24.0 m |
λ = 10.71 mm; d_FF = 67.2 m |
Antenna pattern measurements require >= 67.2 m range at 28 GHz |
Parabolic Dish Gain (η_ap = 0.60) |
G = 10·log10[η·(π·D/λ)^2] |
+33.75 dBi (35.97 dBi ideal) |
+42.69 dBi (+8.94 dB per dish) |
28 GHz adds +17.88 dB total TX + RX aperture gain |
Half-Power (-3 dB) Beamwidth (θ_3dB) |
θ_3dB ≈ 70° · (λ / D) |
3.50° (±1.75° to -3 dB ring) |
1.25° (±0.625° to -3 dB ring) |
2.80× narrower beamwidth demands rigid tower mounts |
Pointing Loss at Δθ = 0.25° Wind Sway (2 ends) |
L_pt,tot = 2 × 12 · (Δθ / θ_3dB)^2 |
-0.12 dB (-0.06 dB per dish) |
-0.96 dB (-0.48 dB per dish) |
7.84× higher pointing loss for identical angular sway |
Pointing Loss at Δθ = 0.50° Severe Gust (2 ends) |
L_pt,tot = 2 × 12 · (Δθ / θ_3dB)^2 |
-0.49 dB (-0.245 dB per dish) |
-3.84 dB (-1.92 dB per dish) |
Unbraced poles cause multi-dB modulation hits at Ka-band |
First Fresnel Zone Mid-Path Radius (d = 15 km) |
F_1 = 17.32 · sqrt(7.5 × 7.5 / (f · 15)) |
7.75 m (0.6·F_1 = 4.65 m) |
4.63 m (0.6·F_1 = 2.78 m) |
Higher frequency tightens the Fresnel clearance cylinder |
Port Impedance Mismatch (VSWR = 1.50:1) |
`L_mis = -10·log10(1 - | Γ | ^2) ( |
Γ |
Receiver Thermal Noise Floor (kTB + NF), G/T Figure of Merit, and E_b/N_0 Sensitivity
Once the electromagnetic wave arrives at the receive antenna and passes through the front-end filter and limiter to reach the Low-Noise Amplifier input (RP4), the link budget transitions from propagation physics to statistical thermodynamics. As derived in Michael Steer’s Microwave and RF Design IV: Modules, Chapter 4 (Noise, Distortion, and Dynamic Range) and Analog Devices Tutorial MT-006, every matched resistor or antenna termination at standard reference temperature T_0 = 290 K (16.85 °C) delivers an available thermal noise power spectral density N_0,thermal governed by Boltzmann’s constant (k_B = 1.380649 × 10^-23 J/K):
N_0,thermal = k_B × T_0 = (1.380649 × 10^-23 J/K) × (290 K) = 4.00388 × 10^-21 W/Hz
Converting 4.00388 × 10^-21 W/Hz (4.00388 × 10^-18 mW/Hz) to decibels relative to 1 mW (dBm/Hz):
10 · log10(4.00388 × 10^-18 mW/Hz) = -173.975 dBm/Hz ≈ -174.0 dBm/Hz
1. Antenna-Referred vs. LNA-Input-Referred (RP4) Noise Figure Accounting
When cascading a passive front end (preselector filter + waveguide feed + PIN limiter with total passive insertion loss L_RX, in dB) ahead of an active receiver chain (such as an Analog Devices HMC8410 0.01–10 GHz LNA with 1.1 dB NF and 19.5 dB gain or an ADL8107 6–18 GHz LNA with 1.3 dB NF and 24.0 dB gain driving a downconverter mixer), the Friis cascaded noise factor equation (Analog Devices MT-006) gives the active chain’s noise figure at the LNA input plane (RP4):
F_LNA_chain = F_LNA + (F_post - 1) / G_LNA ⇒ NF_LNA_chain (dB) = 10 · log10(F_LNA_chain)
For our X-band receiver using the HMC8410 LNA (NF_LNA = 1.10 dB → F_LNA = 1.2882, G_LNA = +19.5 dB → 89.125 linear) followed by a downstream downconverter/IF chain (NF_post = 14.3 dB → F_post = 26.92), the cascaded noise factor at RP4 is F_LNA_chain = 1.2882 + (26.92 - 1) / 89.125 = 1.579, or NF_LNA_chain = 2.00 dB.
As highlighted in Panel C of Figure 1, engineers have two mathematically equivalent ways to account for the L_RX = 1.50 dB passive front-end loss ahead of RP4:
- Convention A — Evaluate Signal and Noise at the LNA Input Plane (
RP4, used in our 16-row matrix): SubtractL_RX = 1.50 dBfrom received antenna power (P_RX,RP4 = -37.30 dBm - 1.50 dB = -38.80 dBm) and useNF_LNA_chain = 2.00 dB, givingN_RP4 = -174.0 + 73.01 + 2.00 = -98.99 dBmandSNR = -38.80 - (-98.99) = 60.19 dB. - Convention B — Evaluate Signal and Noise at the Antenna Port (
RP3/Ant): Keep received carrier power at the antenna port (P_RX,ant = -37.30 dBm) and includeL_RX = 1.50 dBas Stage 1 of the Friis equation soNF_ant = L_RX + NF_LNA_chain = 1.50 + 2.00 = 3.50 dB, givingN_ant = -174.0 + 73.01 + 3.50 = -97.49 dBmandSNR = -37.30 - (-97.49) = 60.19 dB.
Never subtract L_RX from P_RX while also using the antenna-referred NF_ant = 3.50 dB; doing so double-counts L_RX and artificially penalizes the link budget by 1.50 dB.
2. Converting Between C/N_0, Channel SNR, Spectral Efficiency η_spec, and E_b/N_0
In digital satellite and microwave telemetry links (NASA JPL DESCANSO Monograph 1), modems specify their demodulation lock threshold in terms of energy per information bit to noise power spectral density (E_b/N_0, in dB), whereas analog RF engineers measure Carrier-to-Noise Ratio (SNR or C/N, in dB) within effective noise bandwidth BW (Hz). Because carrier power C = E_b × R_b (where R_b is the information bit rate in bits/s) and total channel noise power is N = N_0 × BW, the exact conversion is:
SNR (dB) = (C / N)_dB = (E_b / N_0)_dB + 10 · log10( R_b / BW_Hz )
The ratio η_spec = R_b / BW_Hz (bits/s/Hz) is the waveform’s net spectral efficiency (equal to log2(M) × R_code for M-ary modulation with forward error correction code rate R_code, assuming raised-cosine Nyquist symbol shaping where occupied noise bandwidth BW ≈ R_sym). The table below maps E_b/N_0 to required channel SNR_req and minimum receiver sensitivity S_min across standard adaptive modulation states in a BW = 20.0 MHz (10·log10(20 × 10^6) = 73.01 dB-Hz) channel:
Waveform & FEC Code Rate (BW = 20.0 MHz) |
Spectral Efficiency (R_b / BW) |
Net Information Bit Rate (R_b) |
Bandwidth Factor 10·log10(R_b/BW) |
Required E_b/N_0 (incl. 1.2 dB Impl. Margin) |
Required Channel SNR_req (dB) |
X-Band S_min (NF = 2.00 dB, N = -98.99 dBm) |
Ka-Band S_min (NF = 3.10 dB, N = -97.89 dBm) |
|---|---|---|---|---|---|---|---|
BPSK Rate-1/2 LDPC (Emergency Telemetry) |
0.50 bit/s/Hz (spread 2×) |
5.0 Mbps (or 10 Mbps) |
-6.02 dB (at 5 Mbps) |
3.50 dB |
-2.52 dB |
-101.51 dBm |
-100.41 dBm |
QPSK Rate-1/2 LDPC (Deep Rain ACM Floor) |
0.50 bit/s/Hz |
10.0 Mbps |
-3.01 dB |
3.81 dB |
+0.80 dB |
-98.19 dBm |
-97.09 dBm |
QPSK Rate-3/4 LDPC (Heavy Rain ACM Mode) |
1.00 bit/s/Hz |
20.0 Mbps |
0.00 dB |
6.50 dB |
+6.50 dB |
-92.49 dBm |
-91.39 dBm |
16-QAM Rate-3/4 LDPC (Moderate Rain Mode) |
2.50 bit/s/Hz |
50.0 Mbps |
+3.98 dB |
8.52 dB |
+12.50 dB |
-86.49 dBm |
-85.39 dBm |
64-QAM Rate-2/3 LDPC (Baseline Clear-Sky) |
4.00 bit/s/Hz |
80.0 Mbps |
+6.02 dB |
9.98 dB (~10.0 dB) |
+16.00 dB |
-82.99 dBm |
-81.89 dBm |
256-QAM Rate-5/6 LDPC (High-Capacity Clear) |
6.00 bit/s/Hz |
120.0 Mbps |
+7.78 dB |
14.72 dB |
+22.50 dB |
-76.49 dBm |
-75.39 dBm |
(Engineering note on LO phase noise: achieving the 16.0 dB (64-QAM) and 22.5 dB (256-QAM) demodulator thresholds requires the upconverter and downconverter Local Oscillators to maintain integrated RMS phase noise below 0.5° to 1.0° RMS so constellation phase error does not consume the implementation margin.)
Step-by-Step RF Link Budget Calculator Matrix: 10.0 GHz X-Band vs. 28.0 GHz Ka-Band (15.0 km Hop)
To demonstrate how every rf calculation formula interacts in a real hardware deployment, we now execute a complete 16-row rf link budget calculator comparison between a 10.0 GHz X-band link and a 28.0 GHz Ka-band link operating over the exact same d = 15.0 km terrestrial line-of-sight hop, using identical D = 0.60 m (2 ft) parabolic dish antennas (η_ap = 0.60), a BW = 20.0 MHz channel bandwidth, and an 80.0 Mbps 64-QAM (SNR_req = 16.0 dB) baseline waveform.
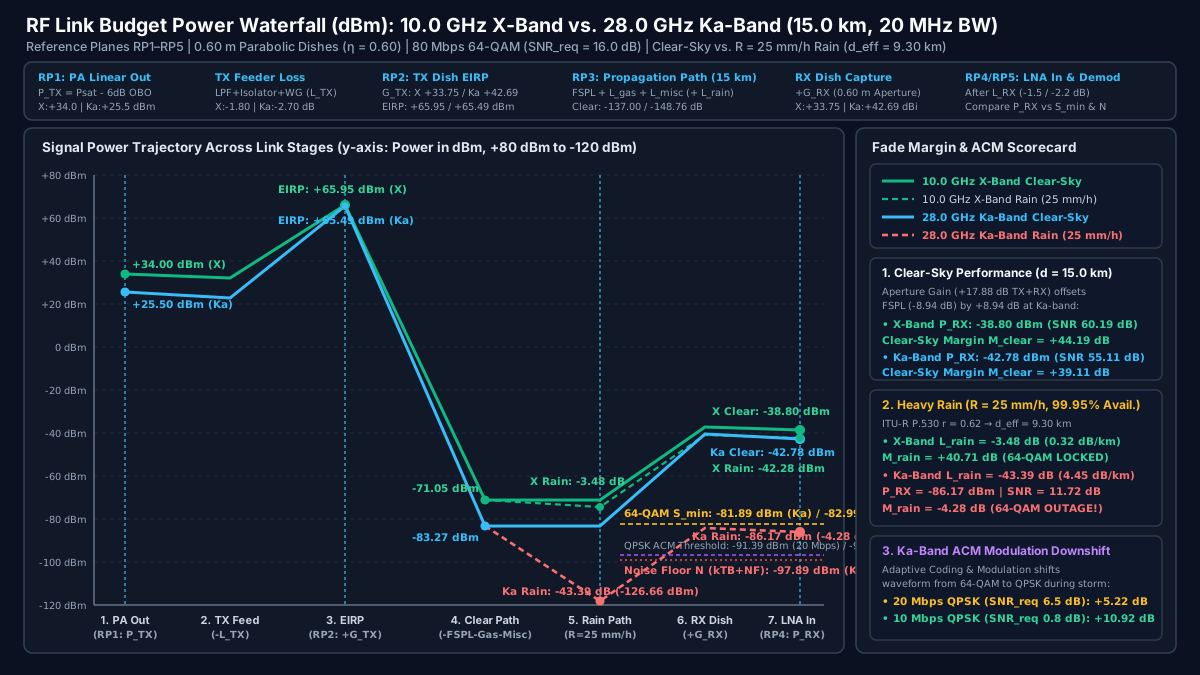
1. Grounded Hardware Benchmarks (HMC7149, ADPA7007, HMC8410, ADL8107)
- X-Band (
10.0 GHz) Transmitter & Receiver:- Transmit PA: Analog Devices HMC7149 (
6–18 GHzGaN MMIC HPA) rated at+40.0 dBm(10.0 W) saturated output power (Psat) and+39.5 dBmOIP3. To transmit64-QAMwithout spectral regrowth, the PA is backed off by6.0 dBfromPsattoP_TX = +34.00 dBm(2.51 W). - Receive LNA: Analog Devices HMC8410 (
0.01–10 GHzGaAs pHEMT LNA) delivering1.1 dBtypical noise figure and19.5 dBgain (or the wideband ADL81076–18 GHzLNA with1.3 dBNF and24 dBgain), yielding a cascaded LNA-input-referred receiver noise figure ofNF_LNA_chain = 2.00 dB.
- Transmit PA: Analog Devices HMC7149 (
- Ka-Band (
28.0 GHz) Transmitter & Receiver:- Transmit PA: Analog Devices ADPA7007 (
20–44 GHzGaAs pHEMT MMIC PA) rated at+31.5 dBm(1.41 W)Psat,+29.0 dBmOP1dB, and up to+42.5 dBmOIP3. Applying the identical6.0 dB64-QAMlinearity back-off fromPsatyieldsP_TX = +25.50 dBm(0.355 W). - Receive LNA: Ka-band GaAs pHEMT LNA (
2.2 dBstage NF,20 dBgain) ahead of a millimeter-wave upconverter and downconverter chain, yielding a cascaded LNA-input-referred receiver noise figure ofNF_LNA_chain = 3.10 dB.
- Transmit PA: Analog Devices ADPA7007 (
2. Complete 16-Row Worked RF Link Budget Calculator Matrix (15.0 km, 20 MHz, 64-QAM)
| Row | Link Budget Stage & Reference Plane | Governing RF Calculation Formula | 10.0 GHz X-Band Value |
28.0 GHz Ka-Band Value |
Ka vs. X Delta (Δ dB) |
|---|---|---|---|---|---|
| 1 | TX PA Linear Output Power (RP1) |
P_TX = P_sat - OBO_64QAM (6.0 dB back-off) |
+34.00 dBm (HMC7149 +40 dBm Psat) |
+25.50 dBm (ADPA7007 +31.5 dBm Psat) |
-8.50 dB |
| 2 | TX Front-End & Feeder Loss (L_TX) |
L_TX = L_LPF + L_iso + L_WG + L_VSWR |
-1.80 dB |
-2.70 dB |
-0.90 dB |
| 3 | TX Parabolic Dish Gain (G_TX, 0.60 m) |
G_TX = 10·log10(0.60 · (π · 0.60 / λ)^2) |
+33.75 dBi (λ = 30.0 mm, θ_3dB = 3.50°) |
+42.69 dBi (λ = 10.7 mm, θ_3dB = 1.25°) |
+8.94 dB |
| 4 | Effective Isotropic Radiated Power (RP2) |
EIRP = P_TX - L_TX + G_TX |
+65.95 dBm (+35.95 dBW / 3.94 kW) |
+65.49 dBm (+35.49 dBW / 3.54 kW) |
-0.46 dB |
| 5 | Free-Space Path Loss at 15.0 km (FSPL) |
FSPL = 92.45 + 20·log10(f_GHz) + 20·log10(15.0) (ITU-R P.525) |
-135.97 dB |
-144.91 dB |
-8.94 dB |
| 6 | Clear-Air Atmospheric Gas Loss (L_gas) |
L_gas = (γ_o + γ_w) × 15.0 km (ρ = 7.5 g/m³, ITU-R P.676) |
-0.23 dB (0.015 dB/km) |
-1.65 dB (0.110 dB/km) |
-1.42 dB |
| 7 | Pointing (Δθ = 0.25°), Pol & Dry Radome (L_misc) |
2·[12·(Δθ/θ_3dB)^2] + L_pol + 2·L_rad,dry |
-0.80 dB (0.12 pt + 0.18 pol + 0.50 rad) |
-2.20 dB (0.96 pt + 0.24 pol + 1.00 rad) |
-1.40 dB |
| 8 | RX Parabolic Dish Gain (G_RX, 0.60 m) |
G_RX = 10·log10(0.60 · (π · 0.60 / λ)^2) |
+33.75 dBi |
+42.69 dBi |
+8.94 dB |
| 9 | RX Preselector, Feed & Limiter Loss (L_RX) |
L_RX = L_BPF + L_feed + L_limiter (ahead of RP4) |
-1.50 dB |
-2.20 dB |
-0.70 dB |
| 10 | Clear-Sky Received Power at LNA In (RP4) |
P_RX,clear = EIRP - FSPL - L_gas - L_misc + G_RX - L_RX |
-38.80 dBm |
-42.78 dBm |
-3.98 dB |
| 11 | Cascaded RX Noise Figure at RP4 (NF_LNA_chain) |
10·log10(F_LNA + (F_post - 1)/G_LNA) (MT-006) |
2.00 dB (HMC8410 1.1 dB NF; 3.50 dB ant-ref) |
3.10 dB (2.2 dB Ka LNA; 5.30 dB ant-ref) |
+1.10 dB |
| 12 | Receiver Thermal Noise Floor in 20 MHz (N) |
N = -174.0 dBm/Hz + 10·log10(20×10^6) + NF_LNA_chain |
-98.99 dBm (-100.99 kTB + 2.00 NF) |
-97.89 dBm (-100.99 kTB + 3.10 NF) |
+1.10 dB |
| 13 | Minimum 64-QAM Sensitivity (S_min, 80 Mbps) |
S_min = N + SNR_req (SNR_req = 16.0 dB, E_b/N_0 = 10.0 dB) |
-82.99 dBm |
-81.89 dBm |
+1.10 dB |
| 14 | Clear-Sky SNR & Clear-Sky Fade Margin (M_clear) |
SNR_clear = P_RX,clear - N; M_clear = P_RX,clear - S_min |
SNR = 60.19 dB | M_clear = +44.19 dB |
SNR = 55.11 dB | M_clear = +39.11 dB |
-5.08 dB |
| 15 | Heavy Rain Attenuation at R = 25 mm/h (L_rain) |
γ_R(25 mm/h) × d_eff (9.30 km) + L_wet_radome (P.838/P.530) |
-3.48 dB (2.98 dB path + 0.50 dB wet radome) |
-43.39 dB (41.39 dB path + 2.00 dB wet radome) |
-39.91 dB |
| 16 | Rain-Faded P_RX,rain, SNR_rain & Net Margin (M_rain) |
P_RX,rain = P_RX,clear - L_rain; M_rain = M_clear - L_rain |
P_RX = -42.28 dBm | SNR = 56.71 dB | M_rain = +40.71 dB (64-QAM LOCKED) |
P_RX = -86.17 dBm | SNR = 11.72 dB | M_rain = -4.28 dB (64-QAM OUTAGE → ACM QPSK: +5.22 dB at 20 Mbps / +10.92 dB at 10 Mbps) |
-44.99 dB |
3. Engineering Audit of the 16-Row Matrix Results
Walk through rows 1 through 16 of the worked matrix to see why intuitive rules of thumb fail without a complete rf link budget calculator:
- Why Ka-band matches X-band
EIRP(Row 4) despite8.5 dBless PA power (Row 1): Although the millimeter-wave GaAs ADPA7007 outputs+25.50 dBmlinear power versus+34.00 dBmfrom the X-band GaN HMC7149 (-8.50 dB) and suffers0.90 dBhigher waveguide feeder loss, the0.60 mtransmit dish produces+42.69 dBiat28.0 GHzversus+33.75 dBiat10.0 GHz(+8.94 dB). The resultingEIRPvalues atRP2are virtually identical:+65.95 dBm(3.94 kW) at X-band vs.+65.49 dBm(3.54 kW) at Ka-band. - Why Clear-Sky Fade Margin (
Row 14) is nearly40 dBon both links: On the receive side (Row 8), the second0.60 mdish adds another+8.94 dBaperture advantage at28.0 GHz, canceling the-8.94 dBhigherFSPL(Row 5). Only incremental clear-air water-vapor absorption (-1.42 dB), narrower-beam pointing/radome loss (-1.40 dB), RX feed loss (-0.70 dB), and LNA noise figure (+1.10 dB) separate the two links—leaving+44.19 dBclear-sky margin at10.0 GHzand+39.11 dBclear-sky margin at28.0 GHz. - Why
25 mm/hConvective Rain (Rows 15–16) Separates X-Band from Ka-Band by39.91 dB: When a heavy convective rainstorm (R = 25 mm/h, corresponding to99.95%annual link availability /4.38 hours/yearexceedance in a temperate-maritime climate) crosses the15.0 kmpath, ITU-R P.530 scales the15.0 kmgeometric distance by path reduction factorr = 0.62(d_eff = 15.0 × 0.62 = 9.30 km). At10.0 GHz, rain + wet radome attenuation is a mild3.48 dB, leavingM_rain = +40.71 dBof rock-solid64-QAMmargin. At28.0 GHz, wavelengthλ = 10.71 mmapproaches the1–6 mmdiameter of oblate raindrops, transitioning from Rayleigh scattering (γ ∝ f^2) into Mie resonance absorption and scattering (4.45 dB/kmpath-averaged ×9.30 km+2.00 dBwet radome =43.39 dBtotal rain fade). - How Adaptive Coding and Modulation (
ACM) Saves the28.0 GHzLink: Under43.39 dBof rain attenuation, Ka-band received power drops toP_RX,rain = -86.17 dBm(SNR_rain = -86.17 - (-97.89) = 11.72 dB). Because80 Mbps64-QAMrequiresSNR_req = 16.00 dB(S_min = -81.89 dBm), fixed64-QAMsuffers a-4.28 dBlink outage. An ACM modem prevents carrier loss by downshifting the waveform in real time:- Downshifting to
20.0 MbpsQPSKRate-3/4 (SNR_req = 6.50 dB,S_min = -91.39 dBm) immediately restores11.72 - 6.50 = +5.22 dBof positive fade margin. - Downshifting one step further to
10.0 MbpsQPSKRate-1/2 (E_b/N_0 = 3.81 dB,10·log10(10/20) = -3.01 dB→SNR_req = 0.80 dB,S_min = -97.09 dBm) restores11.72 - 0.80 = +10.92 dBof positive fade margin, keeping critical command and payload telemetry locked through the storm core.
- Downshifting to
Multi-Band Atmospheric Gas (ITU-R P.676) and Rain Attenuation (ITU-R P.838) Comparison (2.4 GHz to 38.0 GHz)
When selecting a carrier band for point-to-point backhaul, radar RF components, or satellite feeder links, engineers must evaluate both clear-air gaseous absorption (γ_gas = γ_o + γ_w per ITU-R P.676) and specific rain attenuation (γ_R = k · R^α per ITU-R P.838) across candidate bands from S-band (2.4 GHz) through Ka-band (38.0 GHz).
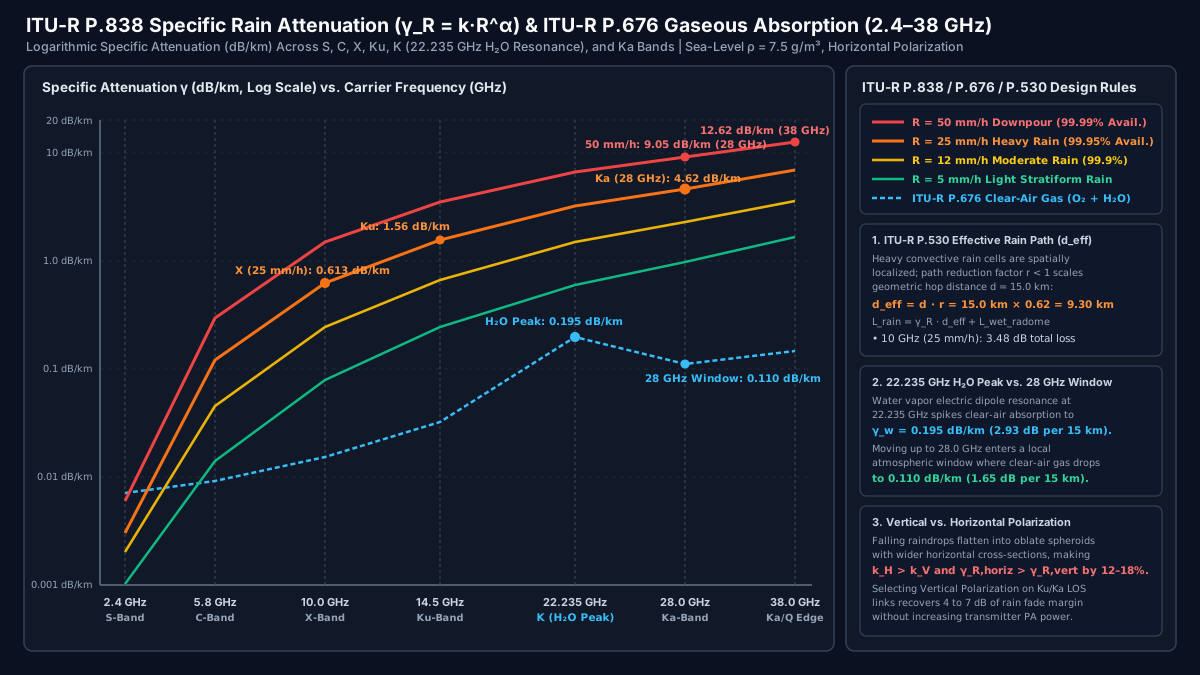
1. 7-Band ITU-R P.838 & ITU-R P.676 Specific Attenuation and 15 km Path Loss Reference Table
The table below lists the horizontal-polarization power-law coefficients (k_H, α_H from ITU-R P.838), sea-level clear-air gaseous attenuation (ρ = 7.5 g/m^3, T = 15 °C, P = 1013.25 hPa from ITU-R P.676), specific rain attenuation γ_R (dB/km) across four rainfall regimes (R = 5, 12, 25, 50 mm/h), and total 15.0 km effective path rain loss (d_eff = 9.30 km + wet radome):
| Microwave Band & Carrier Frequency | ITU-R P.838 Coefficients (k_H, α_H) |
Clear-Air Gas ITU-R P.676 (γ_o + γ_w) |
Light Rain R = 5 mm/h (γ_R) |
Moderate Rain R = 12 mm/h (γ_R) |
Heavy Rain R = 25 mm/h (99.95% Avail.) |
Downpour R = 50 mm/h (99.99% Avail.) |
Total 15 km Rain Loss at 25 mm/h (d_eff = 9.3 km + Wet Radome) |
|---|---|---|---|---|---|---|---|
S-Band (2.4 GHz) |
k_H = 0.00015α_H = 0.960 |
0.007 dB/km (0.11 dB / 15 km) |
0.001 dB/km |
0.002 dB/km |
0.003 dB/km |
0.006 dB/km |
0.03 dB (Rain immune; budget dominated by multipath & Fresnel foliage) |
C-Band (5.8 GHz) |
k_H = 0.00175α_H = 1.308 |
0.009 dB/km (0.14 dB / 15 km) |
0.014 dB/km |
0.045 dB/km |
0.119 dB/km |
0.295 dB/km |
1.11 dB (Preferred band for tropical / monsoon long-haul LOS & SATCOM) |
X-Band (10.0 GHz) |
k_H = 0.01010α_H = 1.276 |
0.015 dB/km (0.23 dB / 15 km) |
0.079 dB/km |
0.240 dB/km |
0.613 dB/km (point) |
1.484 dB/km |
3.48 dB (Easily absorbed by 20–40 dB clear-sky fade margin) |
Ku-Band (14.5 GHz) |
k_H = 0.03750α_H = 1.158 |
0.032 dB/km (0.48 dB / 15 km) |
0.242 dB/km |
0.666 dB/km |
1.558 dB/km |
3.475 dB/km |
15.49 dB (Requires >= 20 dB fade margin or ATPC / ACM for 99.95% availability) |
K-Band H2O Peak (22.235 GHz) |
k_H = 0.10900α_H = 1.052 |
0.195 dB/km (2.93 dB / 15 km H2O peak!) |
0.593 dB/km |
1.488 dB/km |
3.220 dB/km |
6.675 dB/km |
31.45 dB (Avoided for long-range links due to constant 2.93 dB H2O vapor loss) |
Ka-Band (28.0 GHz) |
k_H = 0.20510α_H = 0.968 |
0.110 dB/km (1.65 dB / 15 km window) |
0.974 dB/km |
2.273 dB/km |
4.624 dB/km (point) |
9.048 dB/km |
43.39 dB (Mandates ACM downshift at 15 km, or 3–7 km hops for 99.99%) |
Ka/Q Edge (38.0 GHz) |
k_H = 0.40010α_H = 0.882 |
0.145 dB/km (2.18 dB / 15 km) |
1.654 dB/km |
3.581 dB/km |
6.849 dB/km |
12.615 dB/km |
65.70 dB (Restricted to short-haul 1–4 km high-density urban backhaul) |
2. Three Propagation Physics Rules Every RF Link Architect Must Apply
- The
22.235 GHzWater Vapor Dipole Resonance vs. the28.0 GHzAtmospheric Window: Notice in the table and Figure 2 that clear-air gaseous attenuation is higher at22.235 GHz(0.195 dB/km) than at28.0 GHz(0.110 dB/km). TheH2Omolecule has a permanent electric dipole rotational transition at22.235 GHz(ITU-R P.676). Above24 GHz, water-vapor absorption falls into a local transmission window (27–31 GHz) before climbing toward the60 GHz(57–64 GHz) molecular oxygen (O2) magnetic dipole complex (~15 dB/km, which restricts60 GHzV-band links to< 1 kmsecure/short-range reuse). - Why Vertical Polarization Beats Horizontal Polarization by
4 to 7 dBin Heavy Rain: As raindrops exceed1.5 mmin diameter during heavy showers (R >= 20 mm/h), aerodynamic drag flattens their bottom surfaces into oblate spheroids that are wider horizontally than vertically. Consequently, ITU-R P.838 specifies larger horizontal attenuation coefficients (k_H > k_Vandα_H > α_V), resulting in12% to 18%higher specific rain attenuation (dB/km) on Horizontally Polarized (H-pol) waves than on Vertically Polarized (V-pol) waves. On a15 km,28 GHzlink experiencing43.39 dBofH-polrain loss, switching to Vertical Polarization reduces rain attenuation by~5.5 dB—more than enough to prevent the-4.28 dB64-QAMoutage in Row 16 without changing the power amplifier! - Sky Noise Temperature Rise (
T_sky) Degrades Satellite DownlinkG/TDuring Rain: On terrestrial links where the receive antenna points horizontally at warm terrain (T_ant ≈ 290 K), rain attenuates the carrier byL_rain(dB) without significantly changingT_ant. On low-noise satellite downlinks where the dish points into cold clear sky (T_ant,clear ≈ 25 K to 40 Kand LNAT_rx ≈ 80 K, soT_sys,clear ≈ 110 K), rain acts as a warm lossy attenuator at physical mean medium temperatureT_m ≈ 275 K. Per NASA JPL DESCANSO Monograph 1, rain increases sky noise temperature by:
ΔT_sky (K) = T_m · ( 1 - 10^(-L_rain_dB / 10) )
Under a 10 dB Ku/Ka-band rain fade (10^(-1.0) = 0.10), ΔT_sky = 275 × 0.90 = +247.5 K, tripling T_sys from 110 K to 357.5 K (10·log10(357.5 / 110) = +5.12 dB extra noise floor degradation on top of the 10 dB carrier attenuation!). Satellite downlink rf link budget calculator spreadsheets must always compute both L_rain and ΔT_sky.
RF Link Budget Verification and Pre-Deployment Audit Checklist
Before signing off on a terrestrial microwave hop, UAV datalink, or satellite ground station, audit your rf link budget calculator against the six failure modes in the engineering verification matrix below:
| Common Link Budget Failure Mode | Physical / Mathematical Root Cause | Quantitative Error Magnitude | Mandatory Verification Gate |
|---|---|---|---|
1. Using PA Psat Instead of Backed-Off Linear Power (P_TX) |
Multi-carrier and high-order QAM (16/64/256-QAM) waveforms have 6–10 dB PAPR; running near Psat violates ACPR and crushes constellation EVM |
Overstates link margin by +6.0 to +12.0 dB |
Subtract 6–10 dB OBO (with DPD) or 12–18 dB OBO (without DPD) from Psat at RP1 per RF module T/R cascade architecture |
2. Double-Counting Pre-LNA Passive Loss (L_RX) |
Subtracting preselector/duplexer/limiter loss L_RX from P_RX and using the antenna-referred noise figure NF_ant = NF_LNA + L_RX |
Understates link margin by L_RX (1.5 to 3.5 dB) |
Lock the evaluation plane at RP4 (LNA input) or RP3 (antenna port), never mix the two |
3. Applying Point Rain Rate γ_R Over Full Geometric Distance d |
Multiplying γ_R(25 mm/h) by full d = 15.0 km ignores the spatial localization of heavy convective rain cells |
Overestimates 15 km Ka-band rain loss by +25.6 dB (69.0 vs. 43.4 dB) |
Multiply geometric path d by the ITU-R P.530 distance reduction factor r (d_eff = d · r) |
| 4. Ignoring Wet-Radome Water Film Loss at Ku/Ka-Band | A 0.2–0.5 mm sheet of rainwater on a hydrophobic vs. aged fiberglass radome creates high dielectric reflection and absorption |
Unbudgeted -1.5 to -4.0 dB loss during rain |
Include explicit L_wet_radome (0.5 dB X-band, 1.5–3.0 dB Ka-band) in Row 15 |
5. Neglecting ΔT_sky Noise Rise on Satellite Downlinks |
Atmospheric rain (T_m ≈ 275 K) radiates thermal noise into cold-sky satellite dishes (T_ant,clear ≈ 30 K) via T_m·(1 - 10^(-L/10)) |
Unbudgeted -3.0 to -6.0 dB G/T degradation during rain |
Recompute T_sys,rain = T_ant,rain + T_rx separately from T_sys,clear for every earth-space downlink |
6. Obstructed First Fresnel Zone (< 0.6 · F_1) |
Terrain ridges, buildings, or trees encroaching inside 0.6 · F_1 under low K-factor atmospheric sub-refraction cause knife-edge diffraction |
-6.0 dB loss at grazing (0 · F_1); -15 to -25 dB in shadow |
Verify path profile clearance >= 0.6 · F_1 at K = 4/3 and >= 0.3 · F_1 at K = 2/3 per ITU-R P.530 |
Frequently asked questions
Why does increasing carrier frequency improve clear-sky link budget margin when dish diameter is held constant?
Although ITU-R P.525 Free-Space Path Loss increases with frequency at 20·log10(f) because an isotropic reference antenna's effective capture area A_eff = λ^2/(4·π) shrinks as wavelength λ decreases, a physical parabolic dish of fixed diameter D has gain G = 10·log10[η·(π·D·f/c)^2] that increases at +20·log10(f) on EACH end of the link. Summing TX gain (+20·log10(f)) and RX gain (+20·log10(f)) against FSPL (-20·log10(f)) produces a net +20·log10(f) clear-sky advantage (+8.94 dB moving from 10 GHz to 28 GHz with 0.60 m dishes), at the cost of a 2.8x narrower 3 dB beamwidth and 7.84x higher sensitivity to wind-induced pointing error.
How do you avoid double-counting receiver front-end insertion loss (L_RX) in an RF link budget calculator?
Choose a single evaluation reference plane and apply it consistently to both signal power and noise floor. If you evaluate the link at the LNA input reference plane (RP4), subtract passive preselector, waveguide, and limiter insertion loss L_RX directly from received carrier power P_RX, and use the LNA-input cascaded noise figure NF_LNA_chain. If you evaluate at the antenna aperture port, do not subtract L_RX from P_RX; instead, include L_RX as Stage 1 in the Friis equation so NF_ant = NF_LNA_chain + L_RX. Both conventions give the exact same SNR and fade margin, whereas subtracting L_RX from P_RX AND adding L_RX to NF double-penalizes the link.
Why does atmospheric attenuation peak at 22.235 GHz and drop at 28 GHz in Clear Air?
Per Recommendation ITU-R P.676, the water vapor (H2O) molecule exhibits an electric dipole rotational resonance line centered at 22.235 GHz (K-band), where clear-air specific attenuation reaches 0.195 dB/km at sea-level standard humidity (7.5 g/m^3)—producing 2.93 dB of dry/clear-air gaseous loss over a 15 km path. Above that resonance line, specific attenuation drops into a local atmospheric transmission window around 28 GHz to 31 GHz (0.110 dB/km at 28.0 GHz, or 1.65 dB over 15 km) before rising toward the 60 GHz molecular oxygen (O2) magnetic dipole absorption complex.
How does Adaptive Coding and Modulation (ACM) prevent Ka-band link outages during heavy rain?
During a 25 mm/h convective rainstorm (99.95% annual availability threshold), ITU-R P.838/P.530 rain attenuation on a 15 km, 28 GHz horizontal-polarization link reaches 43.39 dB, exceeding the 39.11 dB clear-sky fade margin for 80 Mbps 64-QAM (SNR_req = 16.0 dB) by 4.28 dB and dropping demodulator SNR to 11.72 dB. Rather than dropping the carrier, an ACM modem senses the C/N0 degradation in real time and downshifts the waveform to QPSK Rate-3/4 (20 Mbps, SNR_req = 6.50 dB, restoring +5.22 dB positive fade margin) or QPSK Rate-1/2 (10 Mbps, Eb/N0 = 3.8 dB, SNR_req = 0.80 dB, restoring +10.92 dB positive fade margin) until the rain cell passes.
Sources
- Recommendation ITU-R P.525: Calculation of Free-Space Attenuation — International Telecommunication Union (ITU-R) Accessed October 25, 2026.
- Recommendation ITU-R P.838: Specific Attenuation Model for Rain for Use in Prediction Methods — International Telecommunication Union (ITU-R) Accessed October 25, 2026.
- Recommendation ITU-R P.676: Attenuation by Atmospheric Gases and Related Effects — International Telecommunication Union (ITU-R) Accessed October 25, 2026.
- Recommendation ITU-R P.530: Propagation Data and Prediction Methods Required for the Design of Terrestrial Line-of-Sight Systems — International Telecommunication Union (ITU-R) Accessed October 25, 2026.
- State-of-the-Art of Small Spacecraft Technology: Communications Subsystem — NASA Small Spacecraft Systems Virtual Institute Accessed October 25, 2026.
- DESCANSO Design and Performance Summary Series, Monograph 1: Telecommunications Link Design — NASA Jet Propulsion Laboratory (JPL) Accessed October 25, 2026.
- Microwave and RF Design IV: Modules — Chapter 4: Noise, Distortion, and Dynamic Range — Engineering LibreTexts (NC State University) Accessed October 25, 2026.
- MT-006 Tutorial: ADC Noise Figure — An Often Misunderstood and Misinterpreted Specification — Analog Devices Accessed October 25, 2026.
- HMC7149 Datasheet: 10 W (+40 dBm) GaN MMIC Power Amplifier, 6 to 18 GHz — Analog Devices Accessed October 25, 2026.
- ADPA7007 Datasheet: 20 GHz to 44 GHz, GaAs pHEMT, 31.5 dBm (>1 W) MMIC Power Amplifier — Analog Devices Accessed October 25, 2026.
- HMC8410 Datasheet: 0.01 GHz to 10 GHz, GaAs, pHEMT, MMIC, Low Noise Amplifier — Analog Devices Accessed October 25, 2026.
- ADL8107 Datasheet: 6 GHz to 18 GHz, GaAs, pHEMT, MMIC, Low Noise Amplifier — Analog Devices Accessed October 25, 2026.